VBA로 차트 오른쪽에 레이블명 자동으로 생성하기(색상, 레이블위치설정)

Computer 관심/Excel & VBA|2022. 3. 9. 15:53
반응형

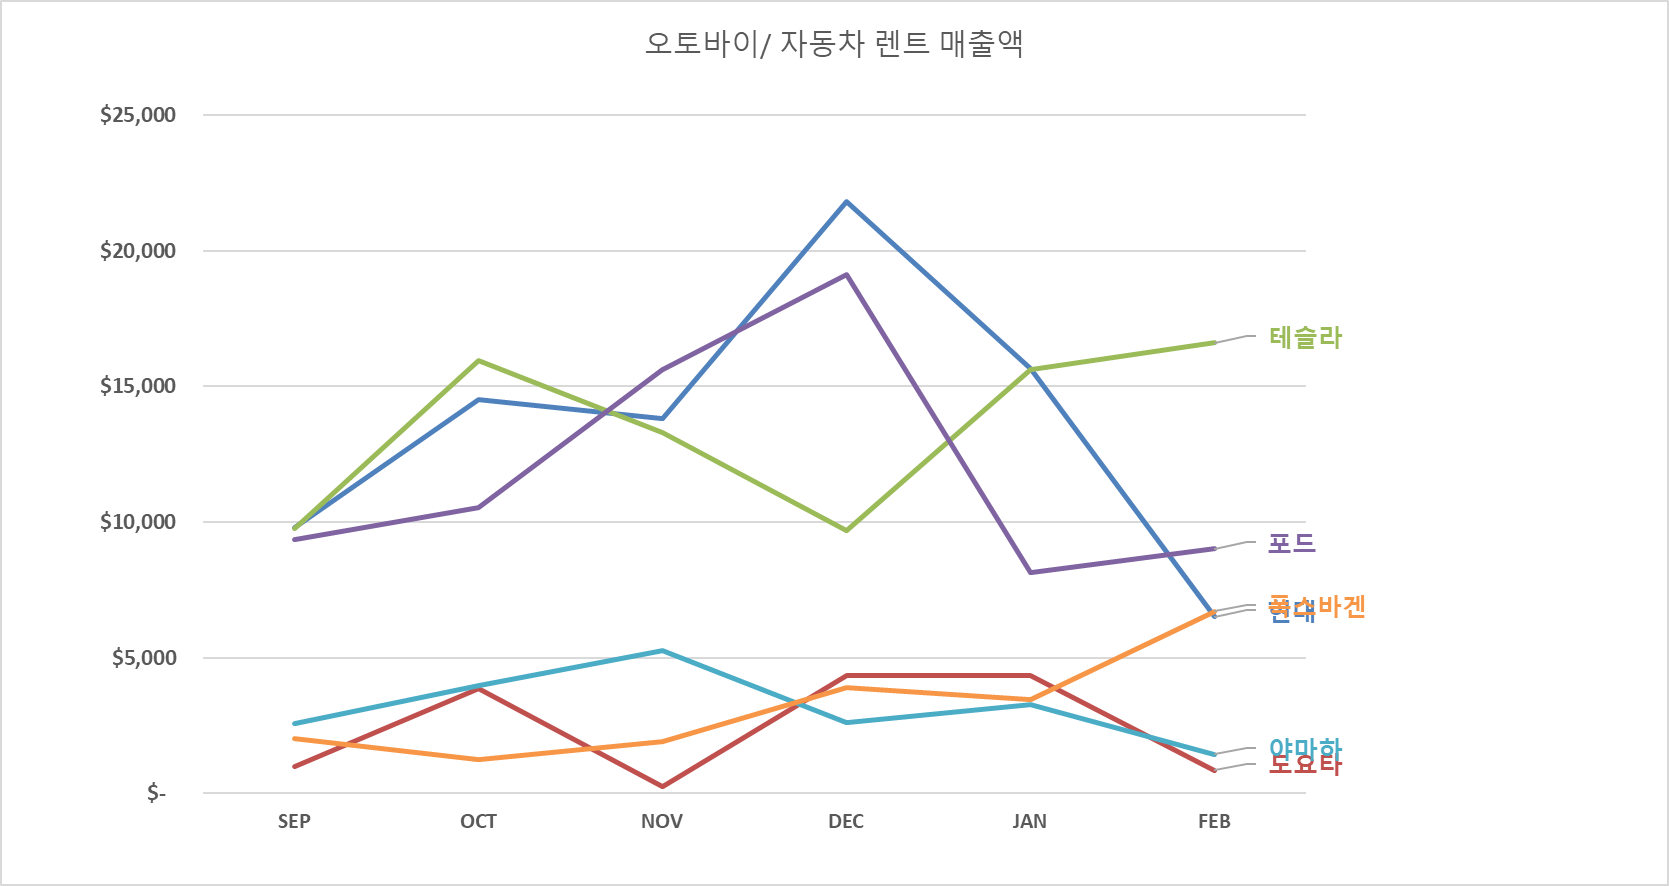
차트의 레이블을 일일이 마우스 클릭하여 입력하고, 색상까지 바꿔주는게 귀찮아서 자동으로 완성해줄 수 있는 VBA가 있는지 찾아봤다.

그리고 그 코드를 약간 수정해서 아래의 결과물을 보여질 수 있는 코드를 만들었다.


결과


사용방법

차트를 클릭한 뒤 메크로로 아래의 코드를 넣은 모듈을 실행시키면 된다.


Sub LastPointLabel()
  Dim mySrs As Series
  Dim iPts As Long
  Dim vYVals As Variant
  Dim vXVals As Variant

  If ActiveChart Is Nothing Then
    MsgBox "Select a chart and try again.", vbExclamation
  Else
    Application.ScreenUpdating = False
    For Each mySrs In ActiveChart.SeriesCollection
      With mySrs
        vYVals = .Values
        vXVals = .XValues
        ' clear existing labels
        .HasDataLabels = False
        
        For iPts = .Points.Count To 1 Step -1
          If Not IsEmpty(vYVals(iPts)) And Not IsError(vYVals(iPts)) _
              And Not IsEmpty(vXVals(iPts)) And Not IsError(vXVals(iPts)) Then
            ' add label
            Set pt = mySrs.Points(iPts)
            pt.ApplyDataLabels _
                ShowSeriesName:=True, _
                ShowCategoryName:=False, ShowValue:=False, _
                AutoText:=True, LegendKey:=False
            Set dl = pt.DataLabel
            With dl
                'text color match to the it's line of the chart
                .Font.Color = mySrs.Format.Line.ForeColor
                .Top = pt.Top - 10
                .Left = pt.Left + 20
                .Font.Size = 12
                .Font.Bold = True
            End With
          End If
        Exit For
        Next
        ' Change the font size to 12
        
      End With
    Next
    ' legend is now unnecessary
    ActiveChart.HasLegend = False
    Application.ScreenUpdating = True
  End If
End Sub


참조

https://peltiertech.com/label-last-point-for-excel-2007/

https://stackoverflow.com/questions/59274616/custom-chart-point-datalabel-position

반응형

댓글()